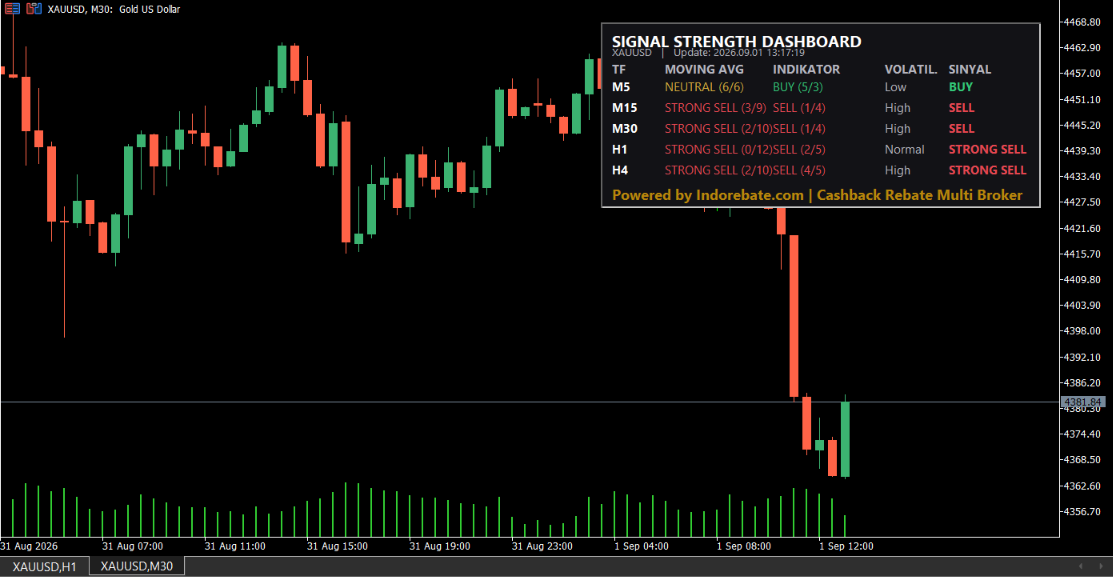
The Signal Strength Dashboard panel right on your MT5 chart — a summary of Moving Average, Oscillator Indicators, Volatility, and the combined Signal for each timeframe (M5–H4), auto-updating every few seconds.
A multi-timeframe technical summary panel right on your MT5 chart — combining Moving Average and 11 oscillator indicators into one signal per timeframe, exclusively for trading accounts that are registered and active at Indorebate.
The Signal Strength Dashboard panel right on your MT5 chart — a summary of Moving Average, Oscillator Indicators, Volatility, and the combined Signal for each timeframe (M5–H4), auto-updating every few seconds.
This indicator is only shared with trading accounts that are registered and active in the Indorebate network. If you use an Indorebate partner broker but your account has not been validated in our system, the indicator cannot be provided. Don't have a registered account yet? Register here or validate your account first.
Signal Strength Dashboard is a pure indicator — it only displays a technical summary on the chart, it does not open, close, or modify any position. All trading decisions remain entirely in your hands.
Inspired by the "Technical Summary" widget on Investing.com — summarizing dozens of indicators into one easy-to-read table, right on the MT5 chart.
| Column / Feature | Description |
|---|---|
| Multi-Timeframe (TF) | Shows summaries for several timeframes at once in a single panel — default M5, M15, M30, H1, H4 (M1 is available and can optionally be enabled). |
| Moving Average | Compares the current price against 6 MA periods (5, 10, 20, 50, 100, 200) x 2 methods (SMA & EMA) = 12 signals per timeframe, then summarizes them into one verdict with the (buy/sell) count beside it. |
| Indicators (Oscillators) | Combines 11 oscillator/momentum indicators: RSI, Stochastic, Stochastic RSI, MACD, ADX, Williams %R, CCI, Highs/Lows 14-period, Ultimate Oscillator, Rate of Change, and Bull/Bear Power — each classified as buy/sell/neutral then summarized. |
| Volatility | Compares the current ATR(14) against the average ATR of the last 20 candles to label it Low, Normal, or High. |
| Signal (Verdict) | The final conclusion per timeframe: combines all Moving Average + Oscillator signals, then gives a verdict of STRONG BUY if ≥65% of signals agree, BUY/SELL if the majority agree, STRONG SELL if ≥65% point the opposite way, or NEUTRAL if balanced. |
| Auto-Update | The panel refreshes automatically every few seconds (default 5 seconds) following the latest market tick, with no manual refresh needed. |
| Customizable Panel | Panel position (4 chart corners), offset distance, font size & type, and buy/sell/neutral colors can be set through the indicator inputs to your taste. |
Register a trading account via the Indorebate referral link → Activate & validate your rebate member status → Contact us to claim Signal Strength Dashboard along with the installation guide.
⚠️ The indicator is only given to accounts verified as registered at Indorebate.
By using this indicator, you understand and agree that trading decisions, results, and risks are entirely your own responsibility as the user.